Getting Started#
After installation, you can easily use Sarcomp in your Python scripts. Simply import the library:
import sarcomp as sc
You can now access the features and functionalities of Sarcomp through the sc object.
Note
Please note that the input data size for the FFT has to be a power of two in the range [64 to 32768]. Currently, other sizes are not supported.
Let’s try it out by performing a FFT:
import numpy as np
from sarcomp import fft
import matplotlib.pyplot as plt
# Generate a test signal
size = 1024
fs = size // 2 # in Hz
n = fs * 2 # 2 seconds
t = np.arange(0, n) / fs
# frequencies to include
freqs = [12, 90, 150]
amps = [10, 15, 20]
signal = np.zeros(n).astype('c16')
# loop over frequencies to create signal
for (amp, freq) in zip(amps, freqs):
signal = signal + amp * np.cos(2 * np.pi * freq * t) + 1j * amp * np.sin(2 * np.pi * freq * t)
# Sarcomp FFT always requires a plan
sc_fft = fft.fft(signal)
# Execute the FFT plan on the given signal
sc_fft()
np_fft = np.fft.fft(signal)
# Verify the results
sc_fft_abs = np.abs(sc_fft)
np_fft_abs = np.abs(np_fft)
absdiff = np.abs(np_fft_abs - sc_fft_abs)
# vector of frequencies in Hz
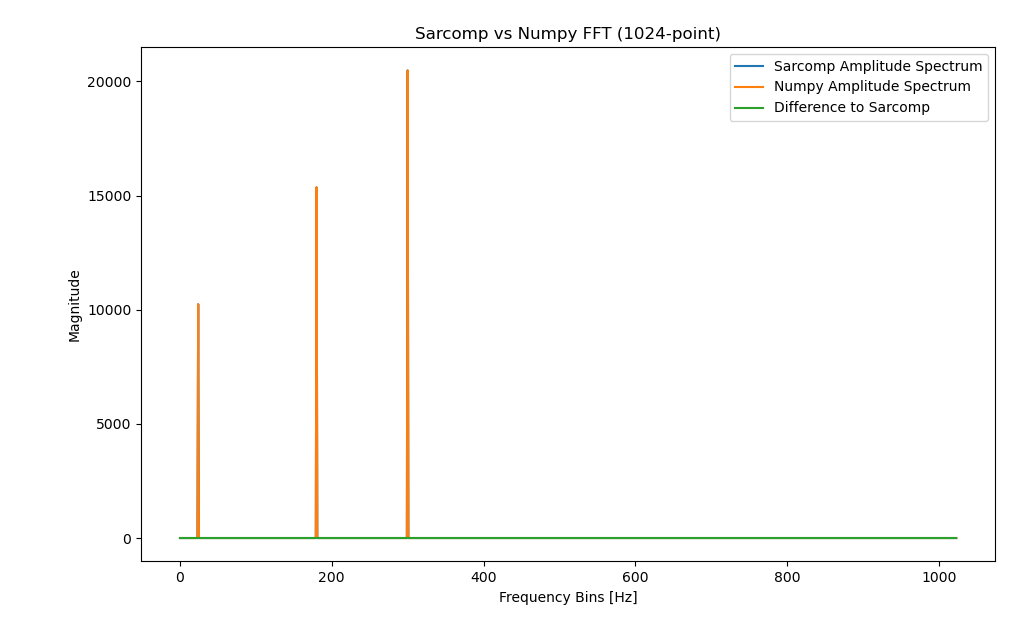
plt.plot(sc_fft_abs, label='Amplitude Spectrum')
plt.plot(np_fft_abs, label='Amplitude Spectrum')
plt.plot(absdiff, label='Difference To Sarcomp')
plt.xlabel('Frequency Bins [Hz]')
plt.ylabel('Magnitude')
plt.title(f'Sarcomp vs Numpy FFT ({size}-point)')
plt.legend(loc=1)
plt.tight_layout()
plt.show()
Result:#